Case Study

SaaS Analytics Dashboard

Multi-tenant analytics interface for product and growth teams.

SaaSB2B SaaS companyMVP Build

Overview

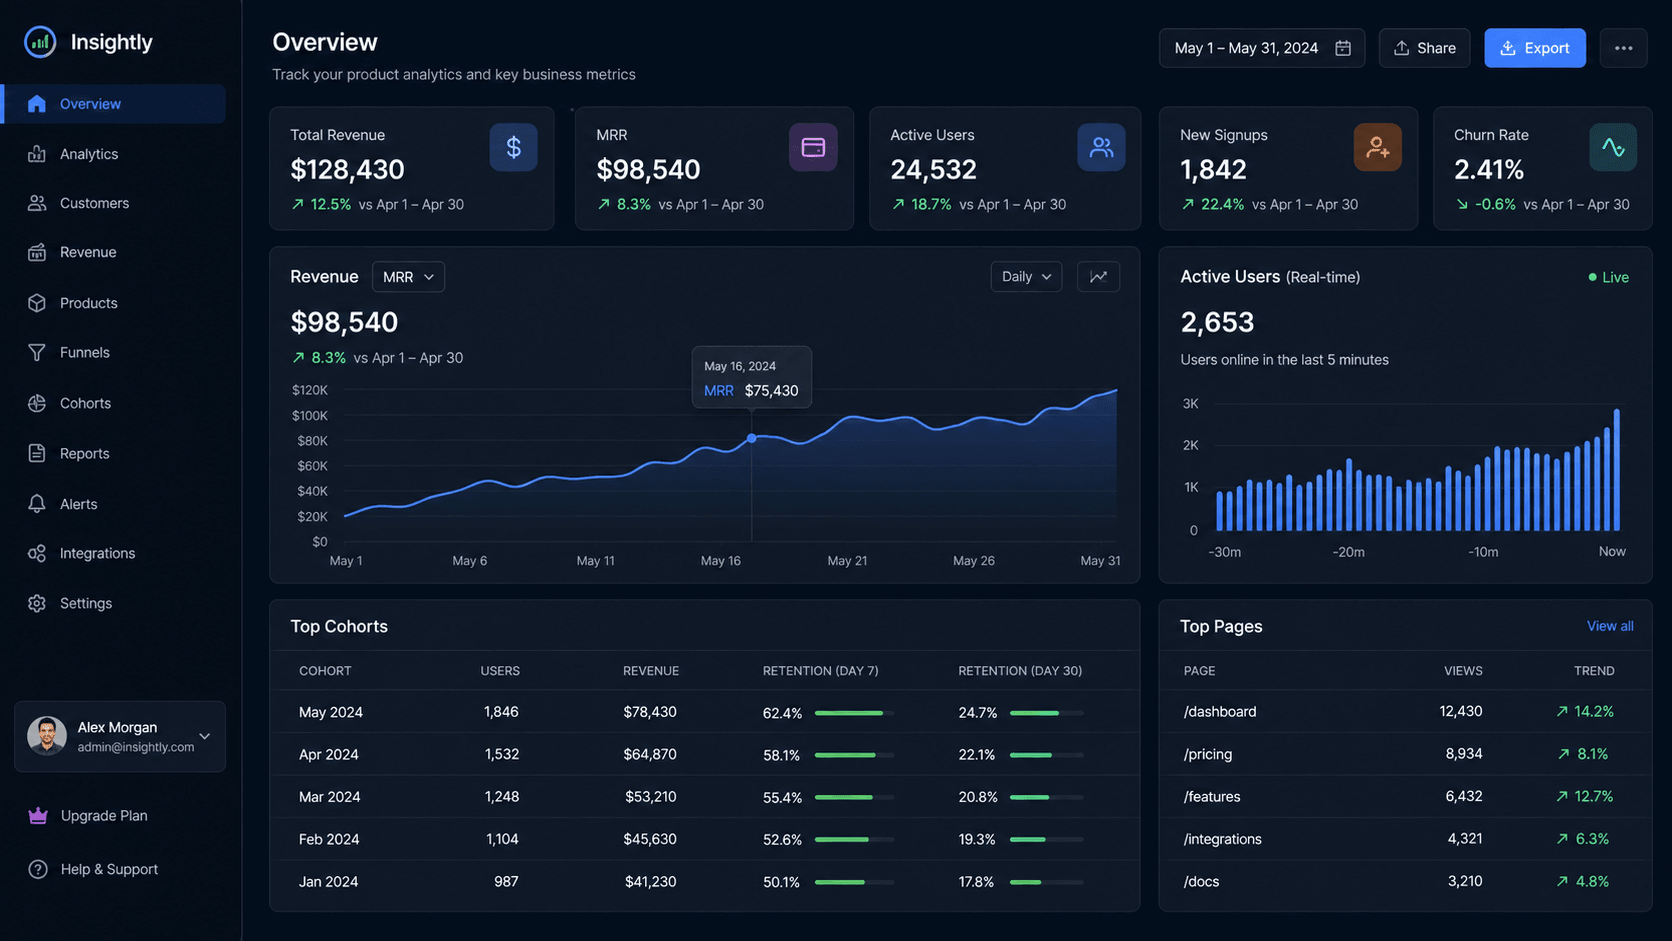
A dashboard suite with trend analytics, cohort grids, and report workflows.

Problem

Teams lacked shared visibility into performance, retention, and adoption behavior.

Constraints

Needed role-aware analytics views across large datasets and tenant boundaries.

Solution

Implemented KPI cards, cohort visualization, and configurable reporting views.

Results and Outcomes

Improved frontend usability and created a scalable foundation for future analytics features.

Timeline

12-16 weeks

Services

Frontend EngineeringData ModelingAPI Development

Tech Stack

ReactNext.jsPostgreSQLAWS

Related Services

SaaS Platform DevelopmentInternal Tools & Dashboards

Product Preview Mockup

Key Features

  • KPI cards
  • Revenue chart
  • Cohort grid
  • Trend indicators
  • Saved filters

Technical Approach and Architecture

  • Multi-tenant schema strategy
  • Caching for high-traffic widgets
  • Background aggregation workers

UI/UX Improvements

Introduced cleaner data hierarchy, filter persistence, and trend-focused layout.

Backend and Infrastructure Work

Designed aggregation jobs, caching strategy, and tenant-aware query boundaries.

Related Projects

AI

AI Industrial Intelligence Platform

AI-assisted operations dashboard for telemetry triage and issue routing.

AIDashboardsOperations
View case study →

Marketplace

Service Marketplace Platform

Service booking marketplace connecting demand, providers, and fulfillment.

MarketplaceBookingSaaS
View case study →

Fintech

Fintech Payment Platform

Secure payments platform with reconciliation visibility and risk controls.

FintechPaymentsSecurity
View case study →

Have a product that needs this level of AI-first execution?

Share your idea, current codebase, or product challenge. We will help you define the right agent and engineering strategy.